
RD Sharma Chapter 23 Class 9 Maths Exercise 23.1 Solutions is based on the Bar Graph and Reading & Interpretation of Bar Graphs. It can be useful for the students practicing on their own. The graphs provided are handy in terms of conducting the analysis of time and distribution of frequency upon offering a transparent account and specific picture of the problems. Data presented in graphical form or statistical form is indeed easy to be understood and in terms of analyzing big data.
Although, we have attached the RD Sharma Chapter 23 Class 9 Maths Exercise 23.1 Solutions PDF in which students will get the varieties of questions and examples with the stepwise solution. All the mentioned in the PDF are prepared by our subject experts. While practicing to prepare for the exam, students will get to know the types of questions based on the Bar Graph and its interpretation.
Learn about RD Sharma Class 9 Chapter 23 (Graphical Representation of Statistical Data)
Download RD Sharma Chapter 23 Class 9 Maths Exercise 23.1 Solutions PDF
Solutions for Class 9 Maths Chapter 23 Graphical Representation of Statistical Data Exercise 23.1
Important Definitions RD Sharma Chapter 23 Class 9 Maths Exercise 23.1 Solutions
As we have mentioned above that this exercise is based on the Graphical Representation of Statistical Data. Go down and check the definition and examples of the same.
- Bar Graph
- Reading and Interpretation of Bar Graphs
Bar Graph
A bar graph is a graph categorically representing data through bars in rectangular form, where the length and width remain in proportion with the value represented by them. Here the bars can be either horizontally or vertically.
Reading and interpretation of bar graphs
Reading and understanding graphs are about analyzing the data where the volumes do correspond to the specific categories.
Examples of RD Sharma Chapter 23 Class 9 Maths Exercise 23.1 Solutions
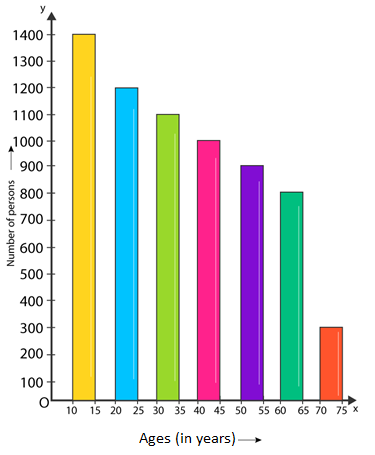
Ques: Study the bar graph depicting the no. of persons in various age groups in a town given in the figure. Observe the bar graph and answer the below questions-
(a) Find the percentage of the youngest age-group persons over those in the oldest age group?
(b) What is the complete population of the city?
(c) What is the no. of persons in the age-group of 60-65?
(d) How many persons are extra in the age-group of 10-15 than in the age group 30-35?
(e) What is the age-group of specifically 1200 persons residing in the city?
(f) What is the total no. of persons residing in the city in the age-group 50-55?
(g) What is the total no. of persons residing in the city in the age-groups 10-15 and 60-65?
(h) Whether the population, in general, is increasing, decreasing, or remains constant with the increase in the age-group.
Solution:
(a) Youngest age-group is 10-15 years
The no. of persons belonging to this group is 1400
The oldest age-group is 70-75 years and
The no. of persons belonging to this group is 300
Now,
The percentage of youngest age-group persons over those in the oldest group are mentioned below-
1400 / 300× 100 = 1400/ 3
(b) Population of the city = 300 + 800 + 900 + 1000 + 1100 + 1200 + 1400 = 6700
(c) No. of persons in the age group of 60 – 65 = 800.
(d) No. of persons in the age group of 10 – 15 = 1400
The number of persons in the age group of 30-35 = 1100.
Hence the no. of more persons in the age group 10 – 15 than the group 30-35 is 1400 — 1100 = 300.
(e) Age group of 1200 persons residing in the city = 20 – 25.
(f) Total no. of persons living in the town in the age-group 50 – 55 is 900.
(g) Total no. of persons living in the town in the age-groups 10 -15 and 60 – 65 is 1400 +800 = 2200.
(h) We have noticed that the height of the bars decreases as the age-group increases. Hence, the population diminishes with the increases in the age-group.